Inspector
Zero includes a rich inspector API that can help you understand performance or behavior issues you are seeing in your apps.
Accessing the Inspector
You access the inspector right from the standard developer console in your browser:
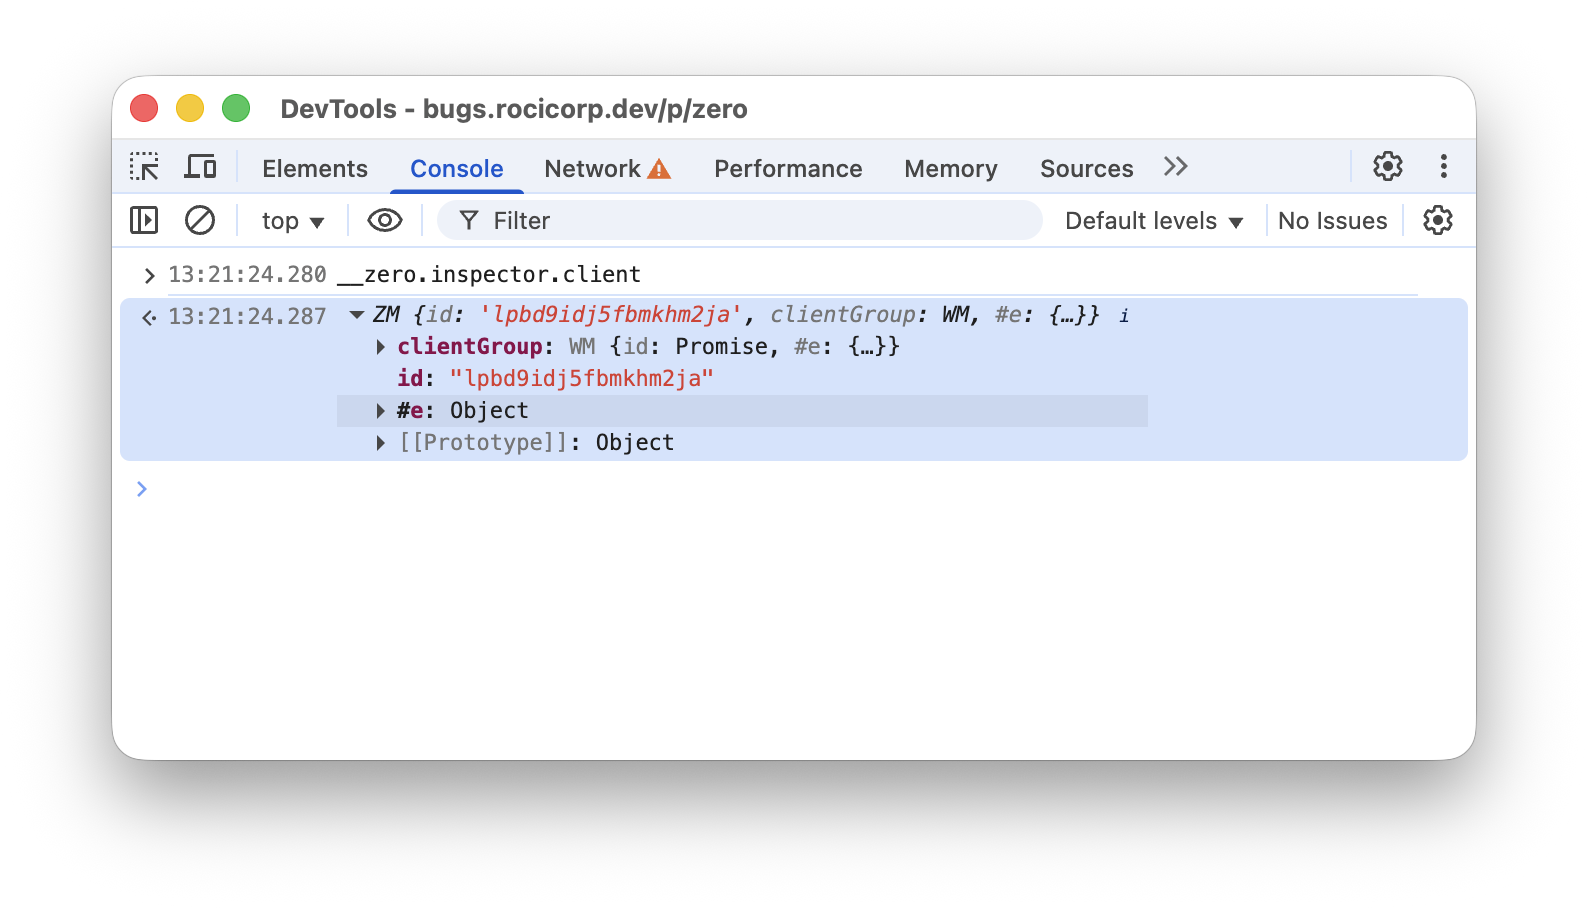
Why hello there, inspector!
For convenience, Zero automatically injects itself as __zero on the global scope of every Zero app.
Clients and Groups
Once you have an inspector, you can inspect the current client and client group. For example to see active queries for the current client:
let qs = await inspector.client.queries();
console.table(qs);
To see active queries for the entire group:
let qs = await inspector.client.queries();
console.table(qs);
Queries
The inspector exposes a bunch of useful information about queries. For example, to see the first query for the current client:
let qs = await inspector.client.queries();
console.log(qs[0]);
This outputs something like:
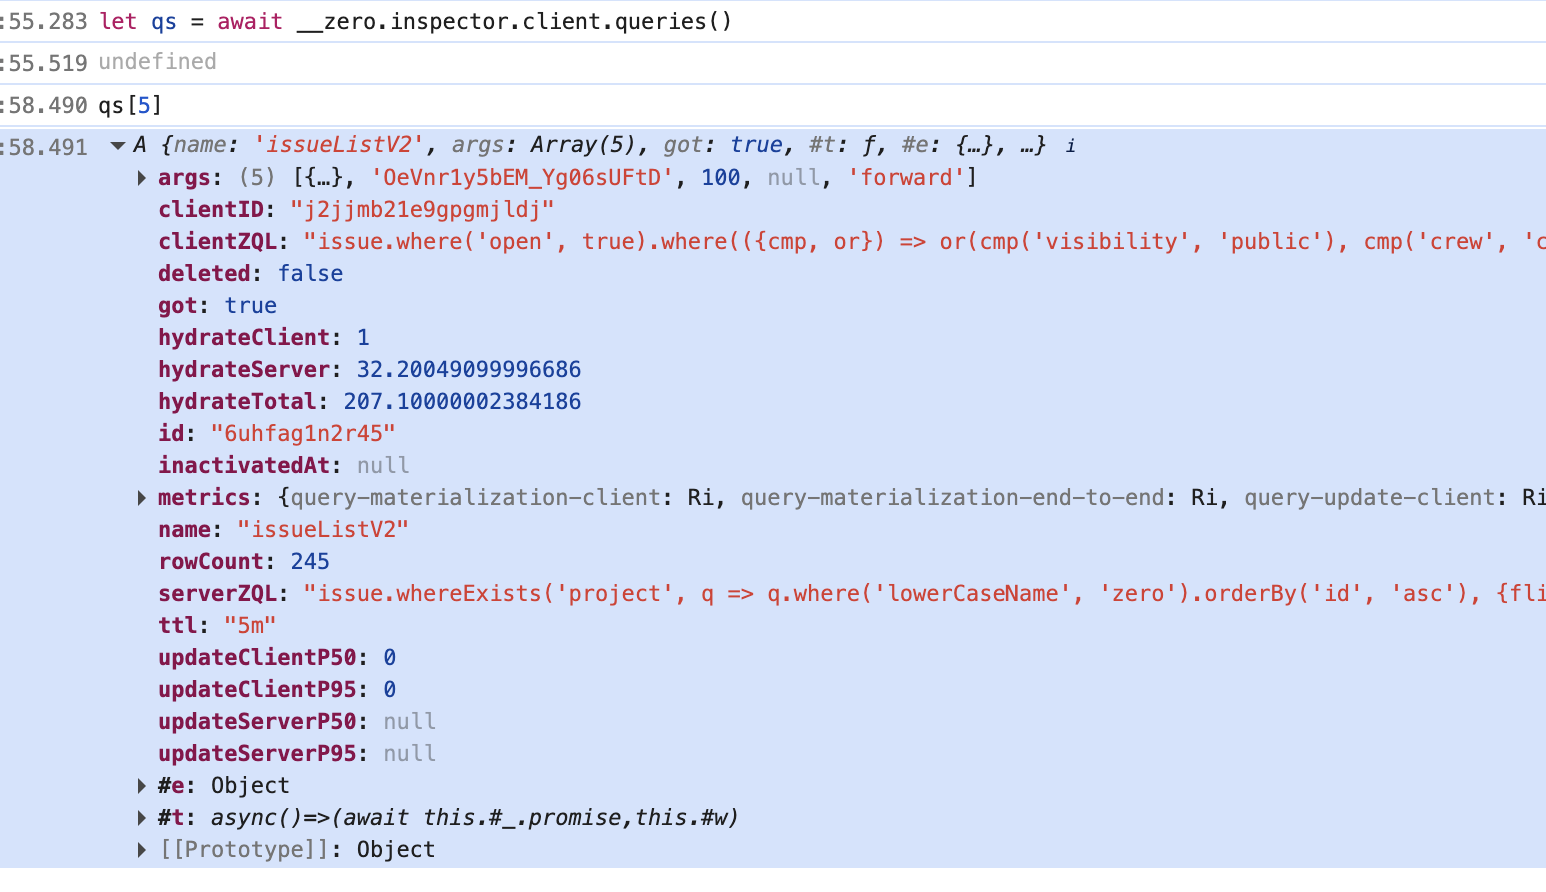
Information about a query
Here are some of the more useful fields:
| Field | Description |
|---|---|
name, args | The name and arguments of the synced query. |
clientZQL | The client-side ZQL run to give optimistic results. |
serverZQL | The server-side ZQL that your get-queries endpoint returned for this query. |
got | Whether the first authoritative result has been returned. |
hydrateClient | How long the client took to hydrate the first optimistic result. |
hydrateServer | How long the server took to hydrate the first authoritative result. |
hydrateTotal | Total time to hydrate the first authoritative result, including network. |
rowCount | Number of rows the query returns. |
ttl | The ttl specified when the query was created. |
inactivatedAt | If non-null, the UI is no longer actively using this query, but it's still running due to ttl. |
updateClientP50,updateClientP95 | Median and 95th percentile time to update the client-side result after a mutation (optimistically). |
updateServerP50,updateServerP95 | Median and 95th percentile time to update the server-side result after a mutation. |
Analyzing Queries
Use the analyze method to get information about how a query hydrates:
await qs[0].analyze();
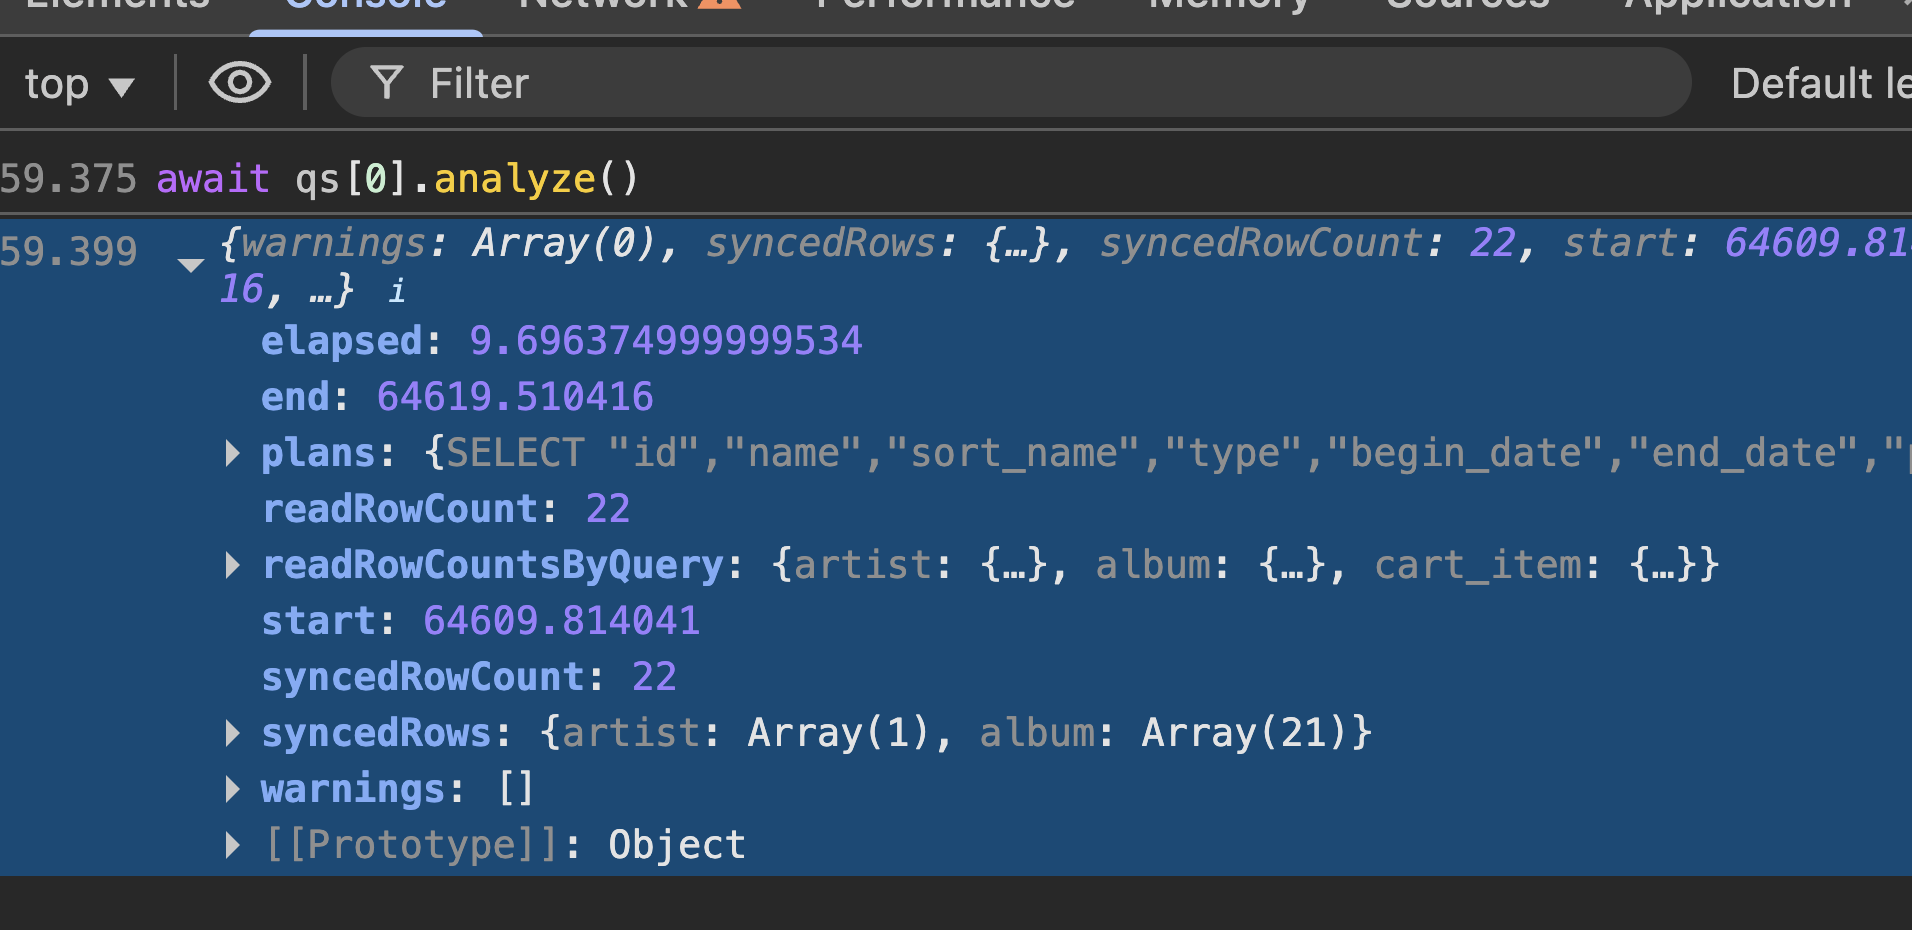
Analyzing a query
Here are some of the most useful fields in the output:
| Field | Description |
|---|---|
elapsed | Total time to run the analysis in milliseconds. This is a good proxy for to how long the query will takes to hydrate in your app. |
readRowCount | Total number of rows read from the replica to find the synced rows. This is often the most important number for performance, since it reflects how much work Zero has to do to hydrate the query. We generally want this to be a small single-digit multiple of syncedRowCount. |
readRowCountsByQuery | Number of rows read by each SQLite query. |
syncedRowCount | Number of rows actually synced to the client for this query. |
syncedRows | The actual rows synced. |
plans | The output from SQLite's EXPLAIN QUERY PLAN for each SQLite query used, which can help you understand why the query is reading more rows than necessary |
Analyzing Arbitrary ZQL
You can also analyze arbitrary ZQL, not just queries that are currently active:
await __zero.inspector.analyzeQuery(
__builder.issues.whereExists('labels', q => q.id.equals('sync')));
This is useful for exploring alternative query constructions to optimize performance.
To use this, you will first have to expose your builder as a property of the global object, so that you can access it from the console. For example:
// schema.ts
// ...
const g = globalThis as any;
g.__builder = builder;
Table Data
In addition to information about queries, you can get direct access to the contents of the client side database.
const client = __zero.inspector.client;
// All raw k/v data currently synced to client
console.log('client map:');
console.log(await client.map());
// kv table extracted into tables
// This is same info that is in z.query[tableName].run()
for (const tableName of Object.keys(__zero.schema.tables)) {
console.log(`table ${tableName}:`);
console.table(await client.rows(tableName));
}
Server Version
Ask the server to confirm what version it is:
console.log('server version: ', await inspector.serverVersion());